Getting Started
Installation
The latest version of the paminco package and the necessary dependencies can be installed directly
from GitHub using pip:
pip install git+https://github.com/paminco/paminco.git
Simple MCA example
Consider the following graph where four vertices (\(s, v_1, v_2, t\)) are connected with five edges.
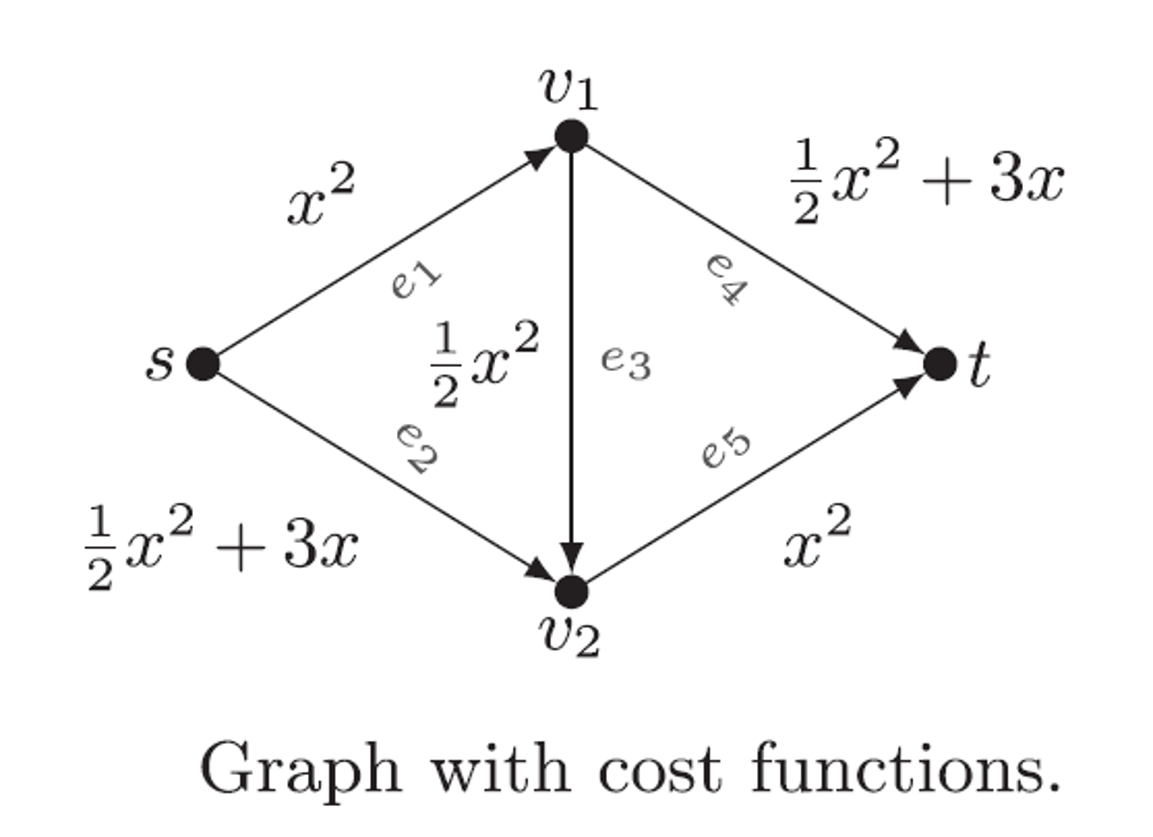
Simple graph with cost functions.
For each edge a cost function \(F_e\) is specified, e.g. the cost on edge \(e_1\) given an edge flow \(x_1\) are \(F_{e_1}(x_1) = x_1^2\). We can setup the above network by specifying edge, cost and demand data as follows:
import numpy as np
from paminco import Network, MCA

edge_data = np.array([[ "s", "v1"],
                      [ "s", "v2"],
                      ["v1", "v2"],
                      ["v1",  "t"],
                      ["v2",  "t"]])
poly_cost = np.array([[0, 0, 1],   # F_0(x) = 0 * x^0 + 0 * x^1 + 1 * x^2
                      [0, 3, 0.5], # F_0(x) = 0 * x^0 + 3 * x^1 + 0.5 * x^2
                      [0, 0, 0.5],
                      [0, 3, 0.5],
                      [0, 0, 1]])
demand_data = (("s", "t", 1))
d = {"s": 0, "v1": 1, "v2": 2, "t": 3}  # determines how labels are mapped to indices
net = Network(edge_data,
              cost_data=poly_cost,
              demand_data=demand_data,
              kw_edge={"map_labels_to_indices": d})
A parametric mincost flow can be found with the MCA algorithm:
mca = MCA(net, lambda_max=8)
mca.run(print=True)
Iteration    1 | λ ∈ [0.000, 1.000]   | ↑ e* = 3 ∈ E* = [1, 3]
Iteration    2 | λ ∈ [1.000, 1.000]   | ↑ e* = 1
Iteration    3 | λ ∈ [1.000, 6.000]   | ↓ e* = 2
Iteration    4 | λ ∈ [6.000, inf]     | ↓ e* = 2 ∈ E* = [0, 1, 2, 3, 4] | EFABreakFlag.LAMBDA_INF
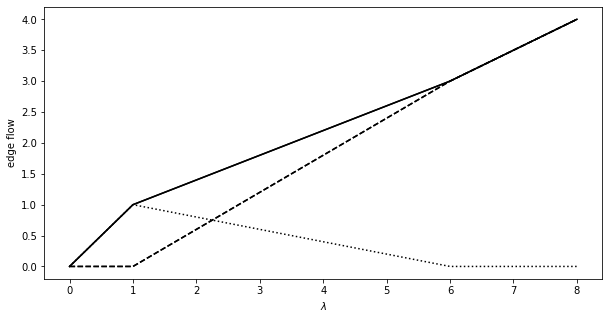
This results in the following parametric edge flows, the mincost flow on an edge w.r.t. to the demand factor \(\lambda\).
import matplotlib.pyplot as plt
fig, ax = plt.subplots(figsize=(10, 5))
x = np.linspace(0, 8, 9)
mca.plot_flow_on_edge(0, x, ax=ax, color="black")
mca.plot_flow_on_edge(1, x, ax=ax, color="black", linestyle="dashed")
mca.plot_flow_on_edge(2, x, ax=ax, color="black", linestyle="dotted")
mca.plot_flow_on_edge(3, x, ax=ax, color="black", linestyle="dashed")
mca.plot_flow_on_edge(4, x, ax=ax, color="black")
ax.set_xlabel("$\lambda$")
ax.set_ylabel("edge flow")
Text(0, 0.5, 'edge flow')